Help us direct you to the right place to sign up

Due to the effects of Covid-19 on the Commercial Real Estate (CRE) market, it is now more important than ever to have access to relevant and reliable data when making business decisions. For lenders underwriting potential loans, it is critical to stay in the know on specific trends in the market as well as understand what leases are taking place in their properties of interest. As opposed to the inefficient process of calling brokers or aggregating market reports, underwriters have the necessary information to vet potential loans using CompStak’s database of commercial real estate transaction data and analytical tools.
When performing due diligence on new loans, it is vital to understand the income that the property is producing as well as its tenant mix. CompStak’s lease transaction data includes detailed rent information such as starting rent, effective rent, and concessions in addition to other useful lease attributes such as tenant name, tenant industry, and lease expiration date. This data can be used for cash flow projections and further enhance the loan vetting process.
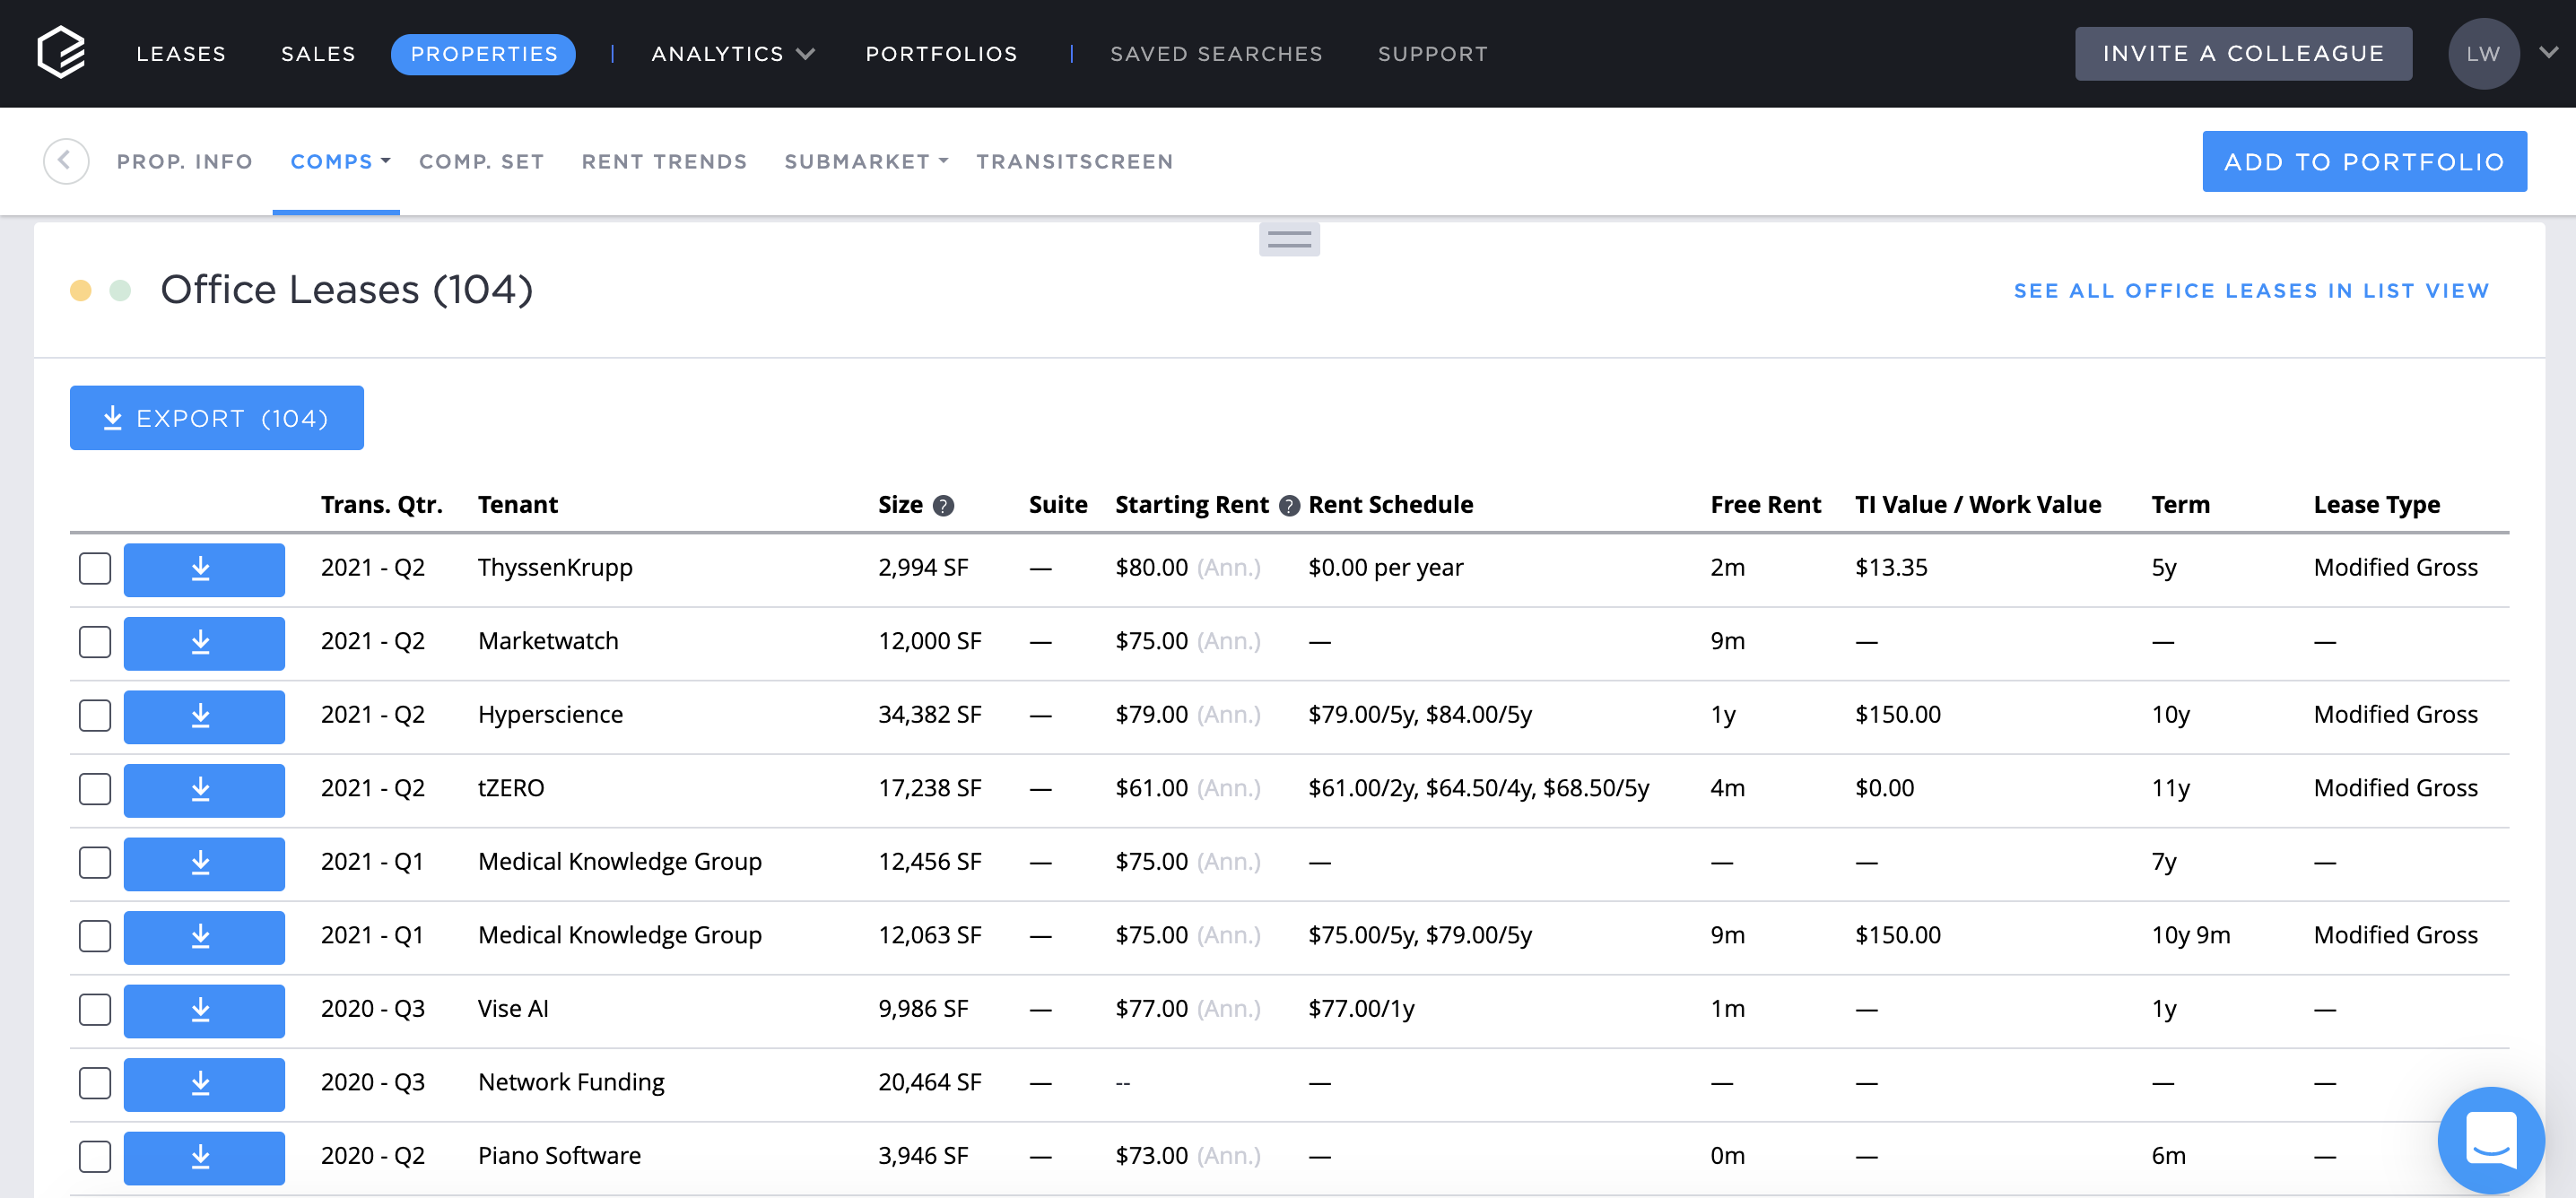
From the CompStak Property page, a user can view a history of lease transactions within a property all in one place to easily compare leases signed before and after COVID.
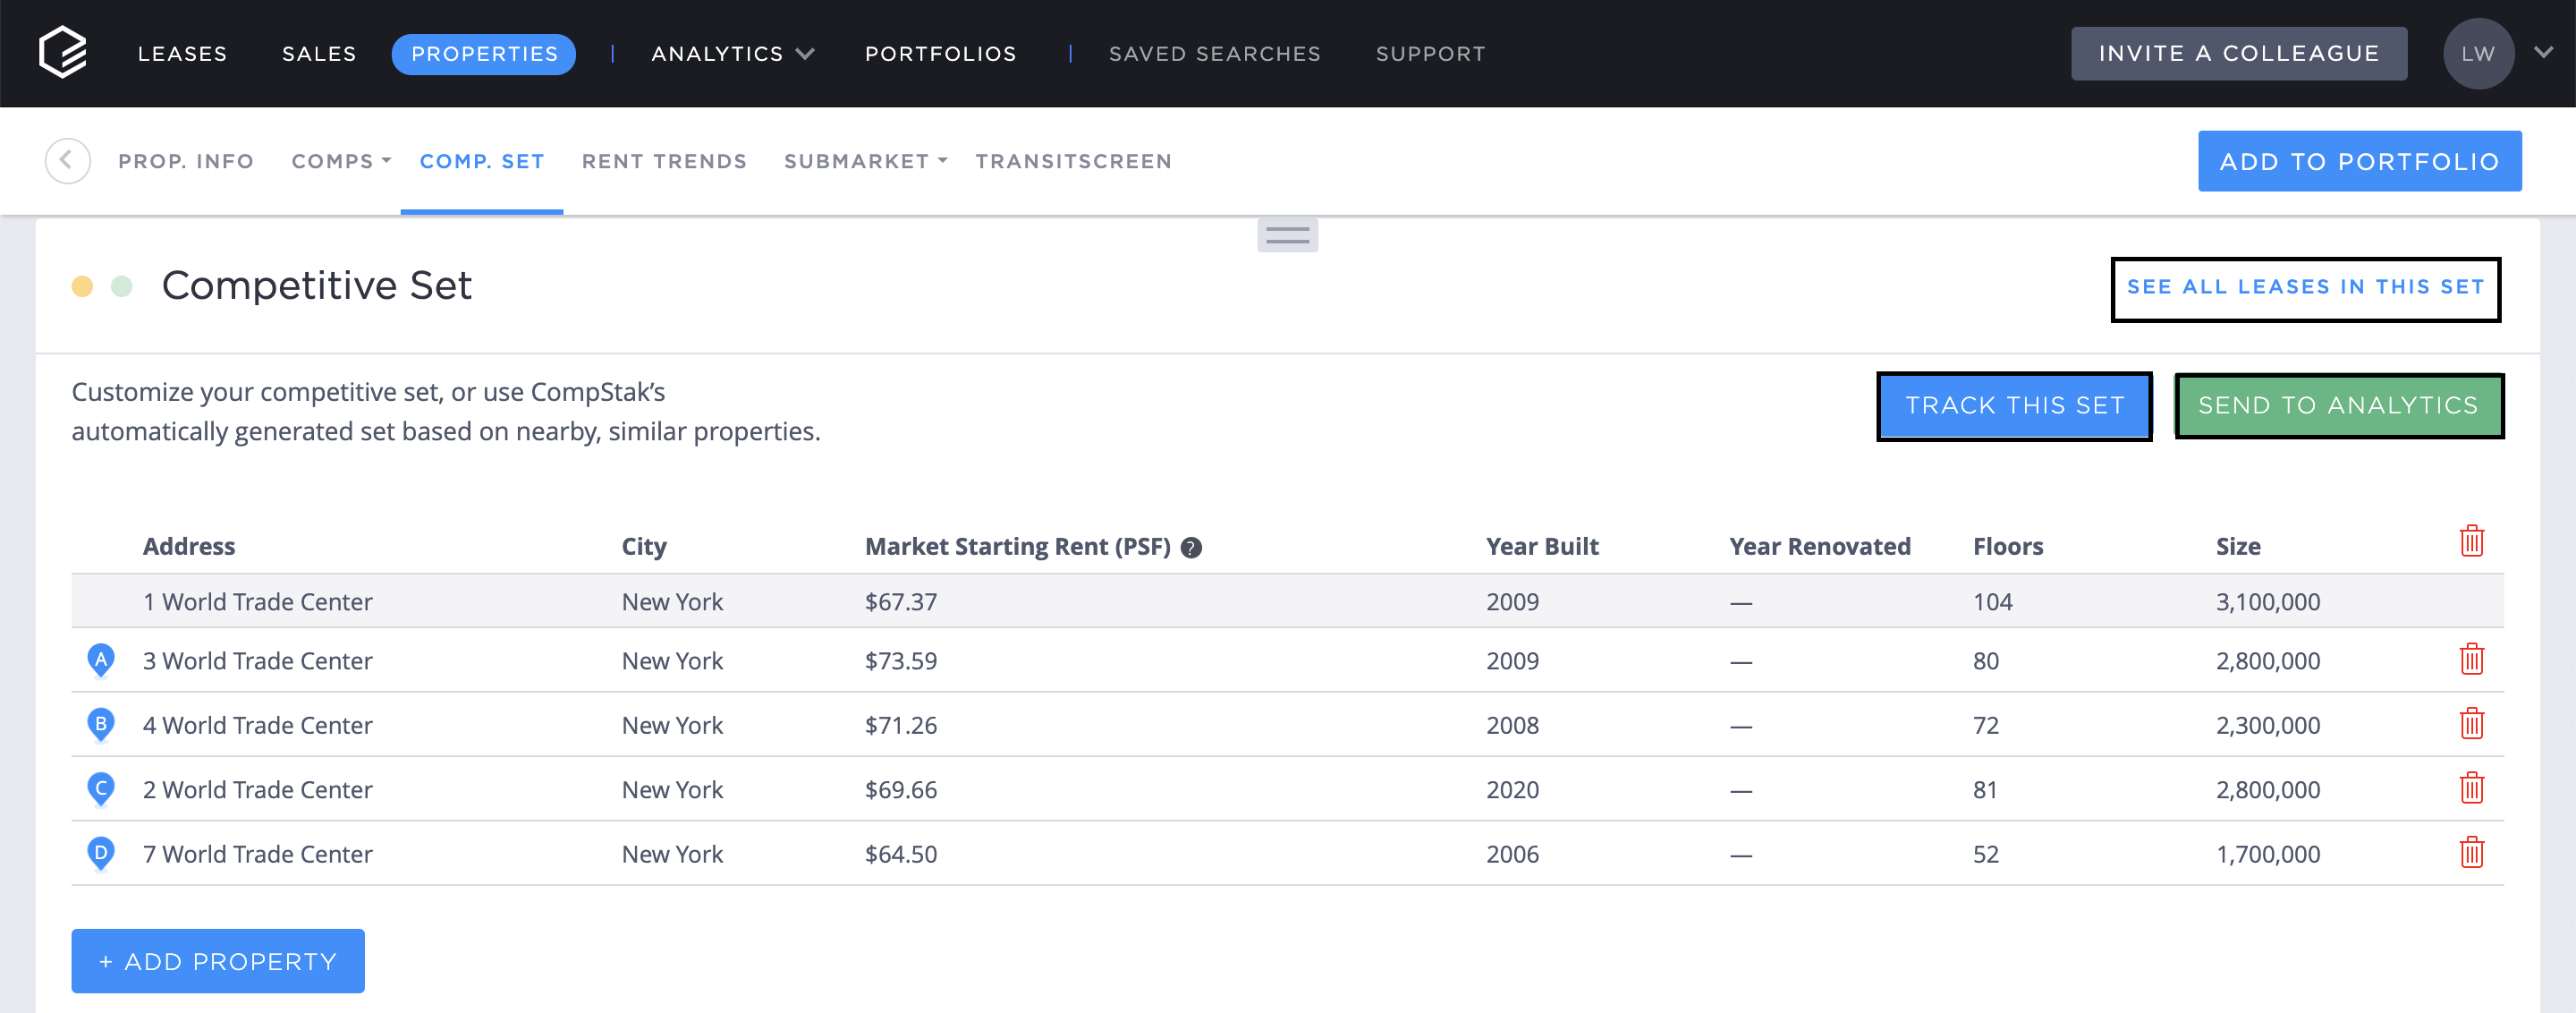
When evaluating a potential loan, it is also important to have a full 360-degree view of the current market landscape with comparable property and nearby neighborhood data. Within each Property Page, CompStak identifies a competitive set of buildings that are similar to the selected property based on market rent, building size, and more.
Lenders are able to evaluate a property’s upside opportunity or risk by reviewing its upcoming lease expirations, future lease rollover, and recent concession negotiations.

As seen with the example of One World Trade, large amounts of expiring space in nearby comparable buildings can lead to competition for tenants and is an added risk that can be accounted for in loan terms. This additional layer of granularity on comparable properties is another value add that CompStak can provide.
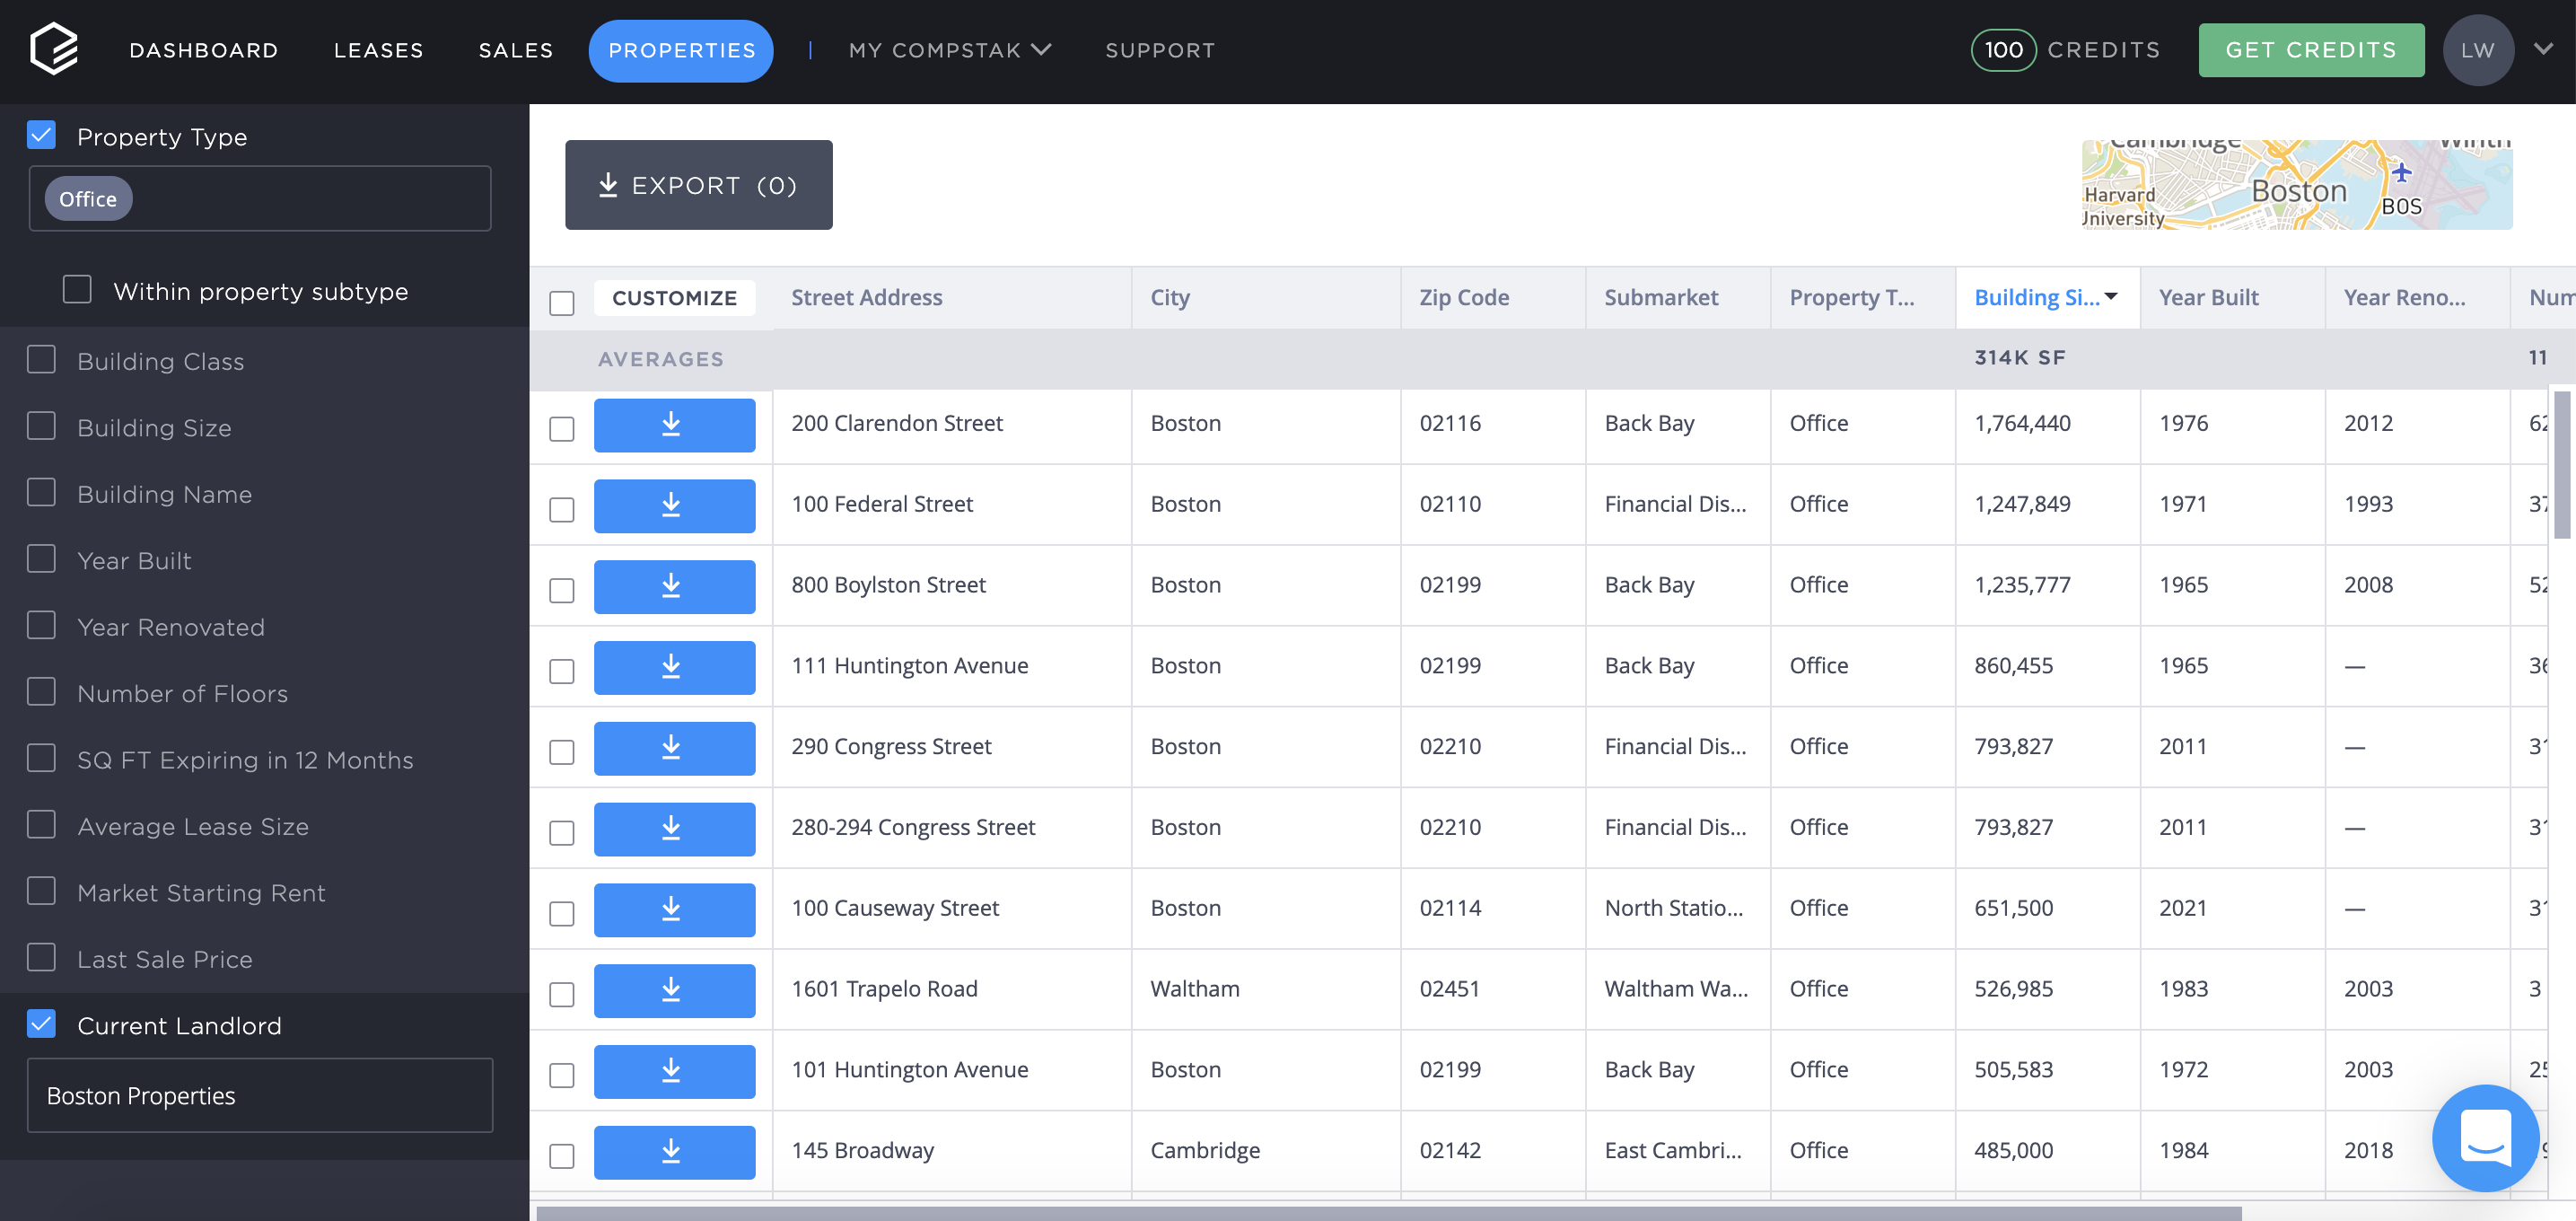
Not only can you see all the leases or sales belonging to the competitive set of properties, but you can also dig into leasing trends with our Analytics suite or create a saved search to track newly signed lease and sale transactions to remain on top of market activity.
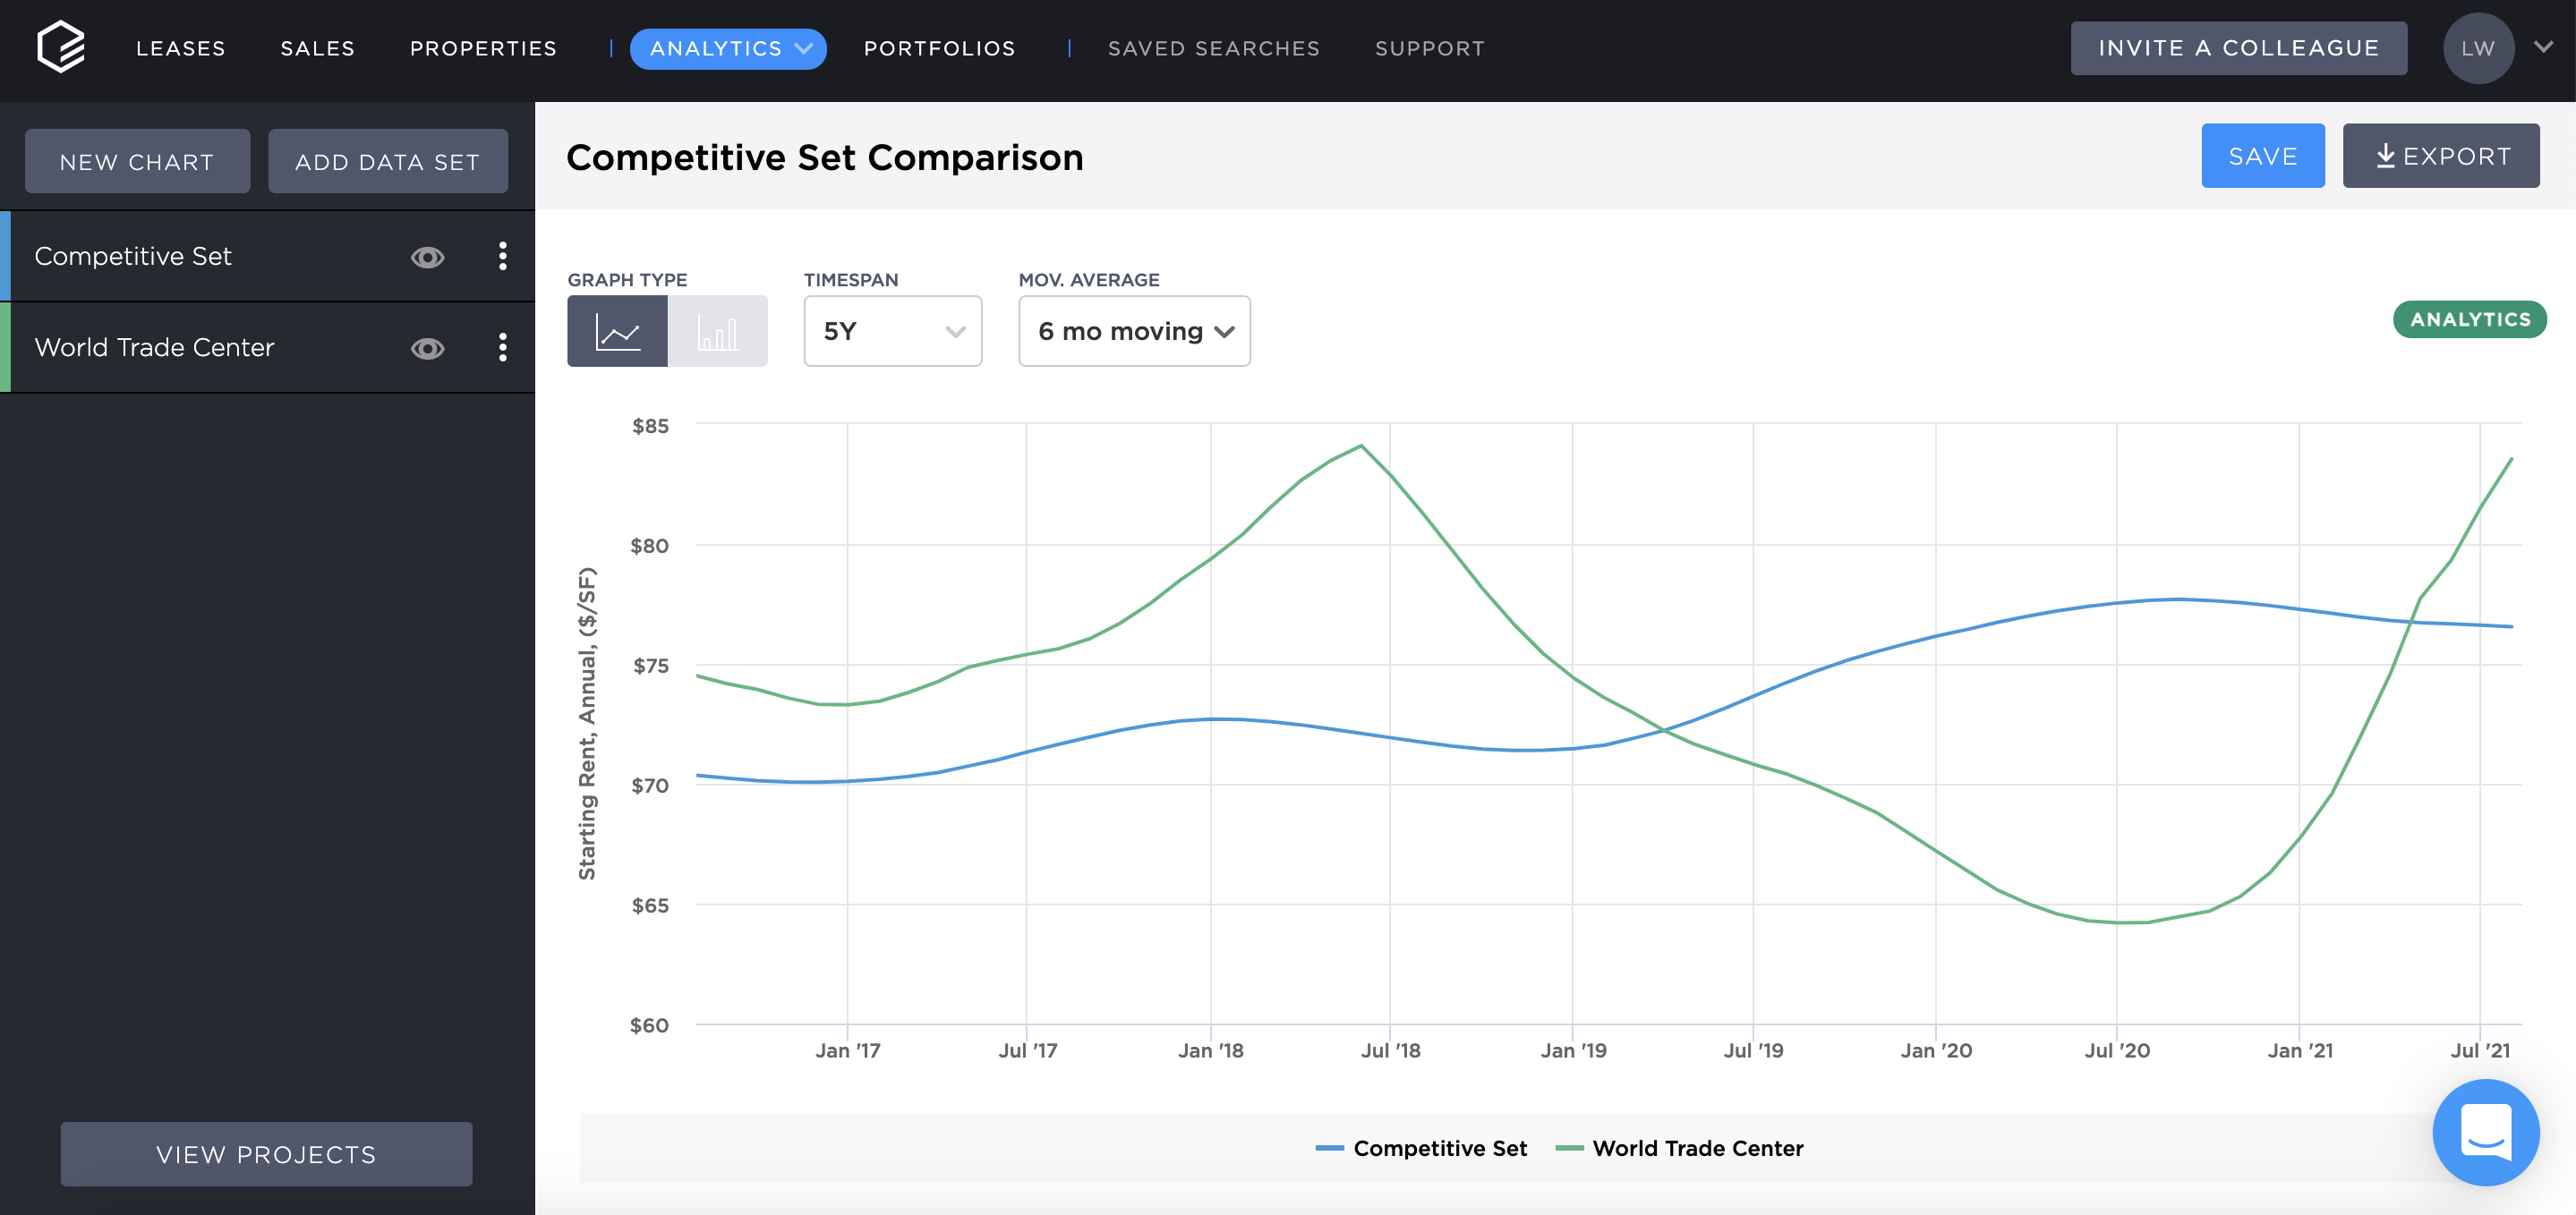
By sending the properties to the Analytics tab, you can view how the starting rent, effective rent, lease terms, and concessions for leases within the properties compare to each other and specific submarkets over time. In the image above, rents in the competitive set were significantly higher than its nearest submarket (World Trade Center) at the beginning of the pandemic, but that trend has since reversed at a rapid pace.
Another area that can impact the underwriting process is the distribution of tenant industries within a property or submarket. Knowing the evolution of tenant industry distribution in the property, competitive set or submarket can provide valuable insight as to what type of tenants may be signing leases in the future.
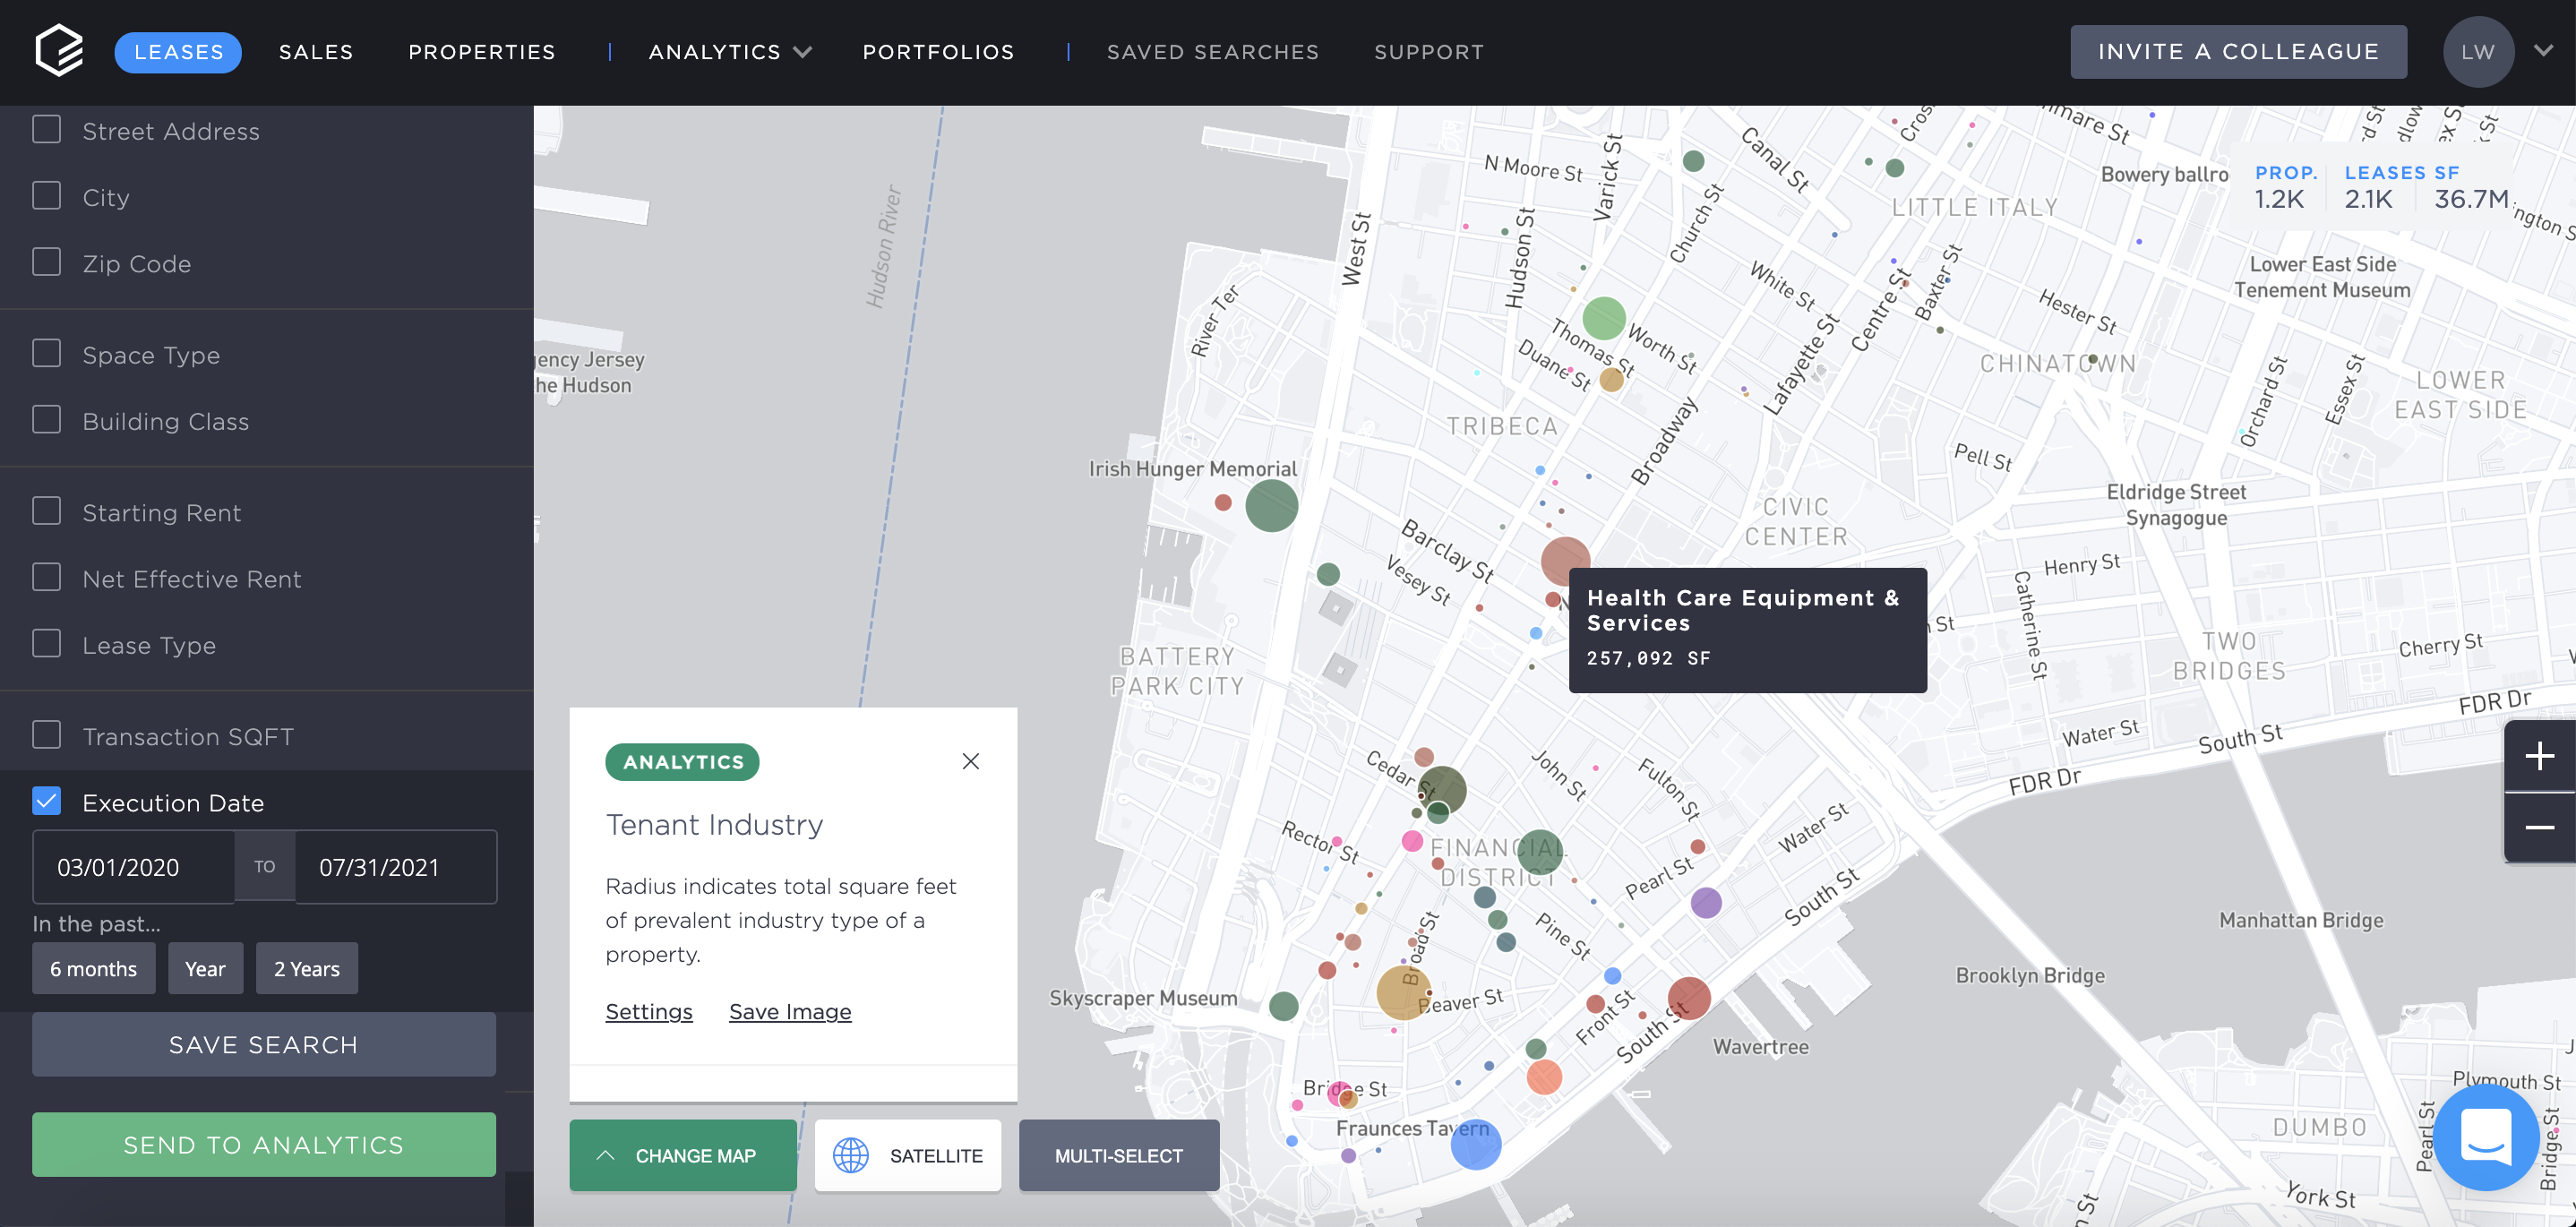
In the image above, over 200,000 square feet of Health Care Equipment & Services space has been leased in the City Hall submarket since the start of the pandemic in March 2020. Health Care, as well as Life Science tenants, can require extensive lab build-outs compared to other industries such as financial services tenants which require less overhead. This is useful information when forecasting future operating expenses for a property.
These are just a few of the ways that CompStak can be utilized to create a more efficient, informed, and data-driven process for lenders when underwriting new loans.
Related Posts
Key Metrics for Commercial Real Estate Underwriting


Key Metrics for Commercial Real Estate Underwriting
The New Digital Age: Embracing Technology for Appraisal Success Webinar Recap


The New Digital Age: Embracing Technology for Appraisal Success Webinar Recap
The Top 10 Office Sectors in Commercial Real Estate to Watch in 2025

