Help us direct you to the right place to sign up

SKIP AHEAD TO:
- What is the Regional Banking Crisis?
- Why did the banks fail?
- What are regional banks’ exposure to CRE loans?
- Is the regional banking situation contained or will it get worse?
- Where is regional bank lending in CRE most highly concentrated and what is the state of CRE in industrial or office in those markets?
- Office Sector Snapshot
- Industrial Sector Snapshot
- What is the outlook going forward?
Founder of Henkel Analytics, covering the regional banking crisis and dug deep into the state of regional banks, why these failures occurred, evaluated current risk and what we can expect going forward. In today’s blog, we are pleased to share the webinar’s major findings as well as key statistics from CompStak’s data on the industrial and office sector in markets with moderate to high commercial real estate (CRE) loan concentrations from regional banks.
Missed the webinar? Check it out on YouTube.
What is the Regional Banking Crisis?
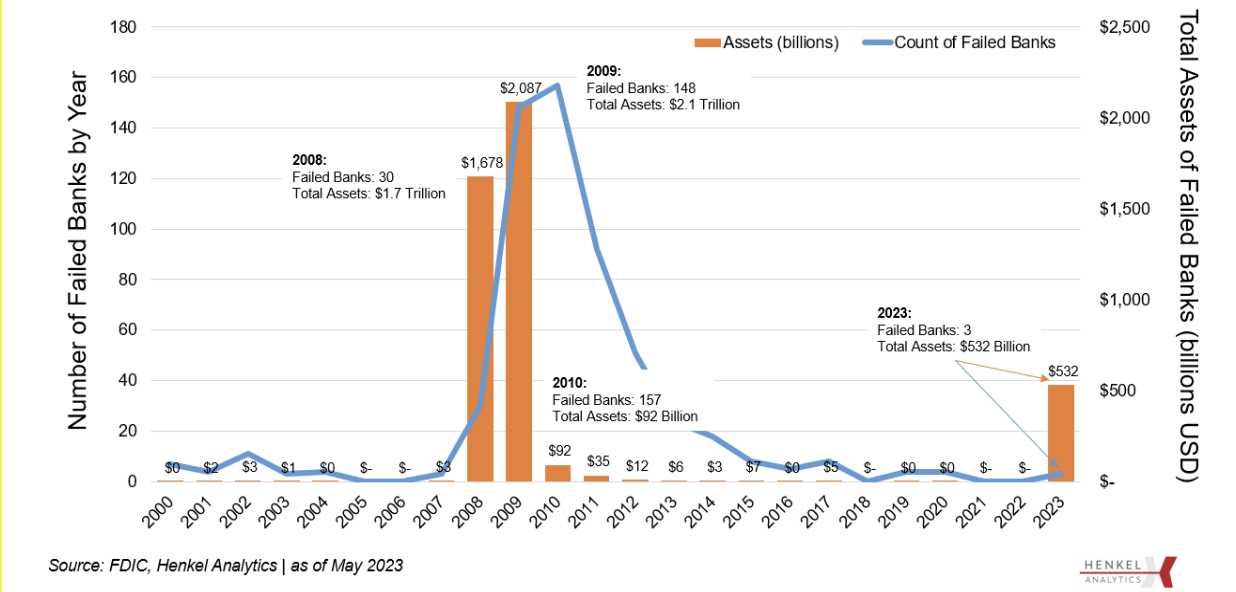
Since the failure of Silicon Valley Bank in early March, there has been no shortage of news and concern about regional bank failures and the risk they pose to the greater economy. Initially, there were widespread fears that many banks would fail but just three banks with assets totaling $532 billion have failed to date in this current cycle, including Silicon Valley Bank, First Republic and Signature Bank. Historical context puts this in perspective; during the Great Financial Crisis, a total of 178 banks failed encompassing more than $3.8 trillion in assets, according to Henkel Analytics.
Regional banks have increased their lending to CRE over the last few years, but they also do not finance the vast majority of CRE loans, as incorrectly stated in many news reports especially in the wake of SVB’s failure.
Why did the banks fail?
These bank failures occurred against the backdrop of a robust rise in interest rate hikes, but that’s not the only reason these banks could not remain afloat. In the current tightening cycle aimed at taming inflation, the Federal Reserve has now raised interest rates a total of 10 times, resulting in a 500 basis point change to the federal funds rate. The target range is now at 5.00%, a level not seen since just preceding the Great Financial Crisis. These rate hikes have occurred over a relatively short time period; from 2004 to 2006, the Federal Reserve enacted a 425 basis point increase but this occurred over a two-year period and 17 separate hikes.
According to Henkel Analytics, rate hikes were just part of the problem. Other complicating issues included the high level of uninsured deposits which were readily able to be withdrawn more quickly and easily than in the previous cycle and the role of social media in creating a panic-driven run on the banks, as noted by the Federal Reserve. In addition, many of the assets held by these banks were low-yielding, long term assets that were sold at a discount, which then turned paper losses into real losses for these banks. Notably, the initial problems that led to these failures were not from CRE, but unfortunately regional banking challenges may negatively impact CRE going forward.
What are regional banks’ exposure to CRE loans?
After the initial failure of Silicon Valley Bank, a flawed statistic stating that 80% of CRE debt was held by regional banks was widely circulated. Since disproven, the exposure is more moderate.
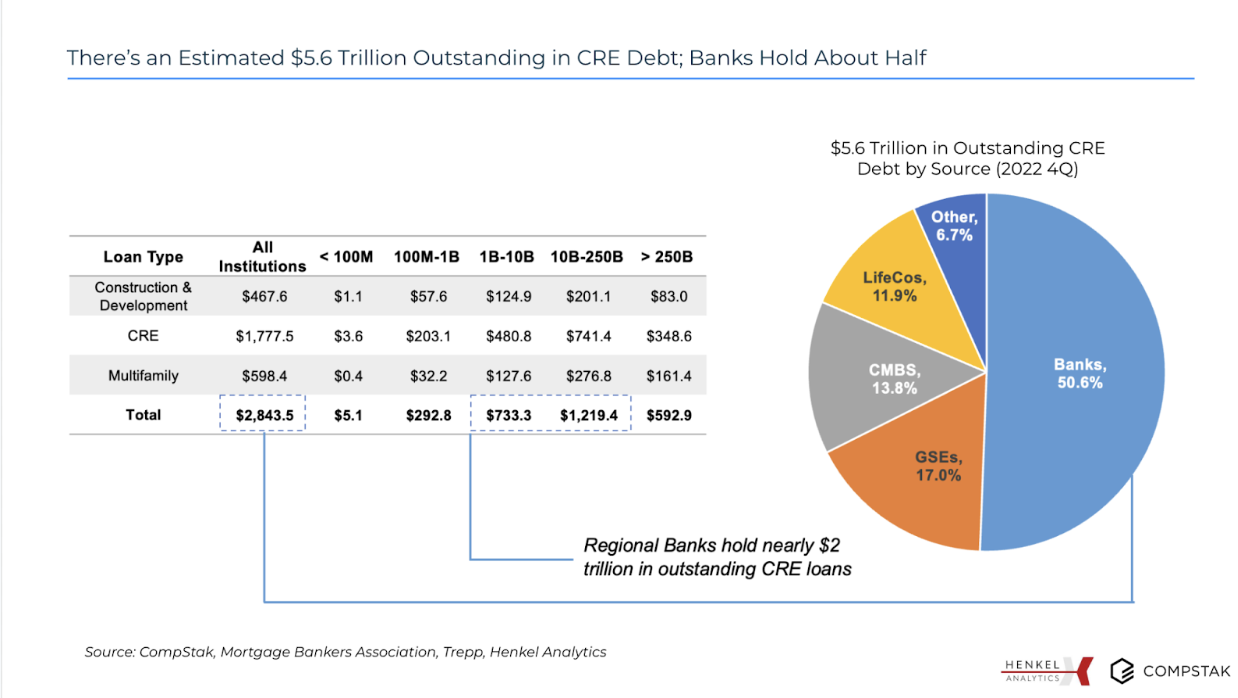
Henkel Analytics neatly broke down this exposure during the webinar, explaining that total CRE loans outstanding is about $5.6 trillion as of year end 2022 and banks hold about half of this outstanding debt or about $2.8 trillion. Within bank exposure, regional banks in particular (banks with assets of $1 Billion-$250 Billion) hold about 69% of that bank debt, or a little more than a third of all outstanding CRE debt overall, not in the range of 80% as many outlets had reported previously.
Still, this number is significant. The total assets held by banks overall has been on a steady rise since 2000 (increasing 214%) at the same time as the number of overall banks have declined by 50%. Additionally, the level of assets held by banks grew sharply during the pandemic; from 2019 to 2021, total asset value held by banks grew more than 27% during this short period.
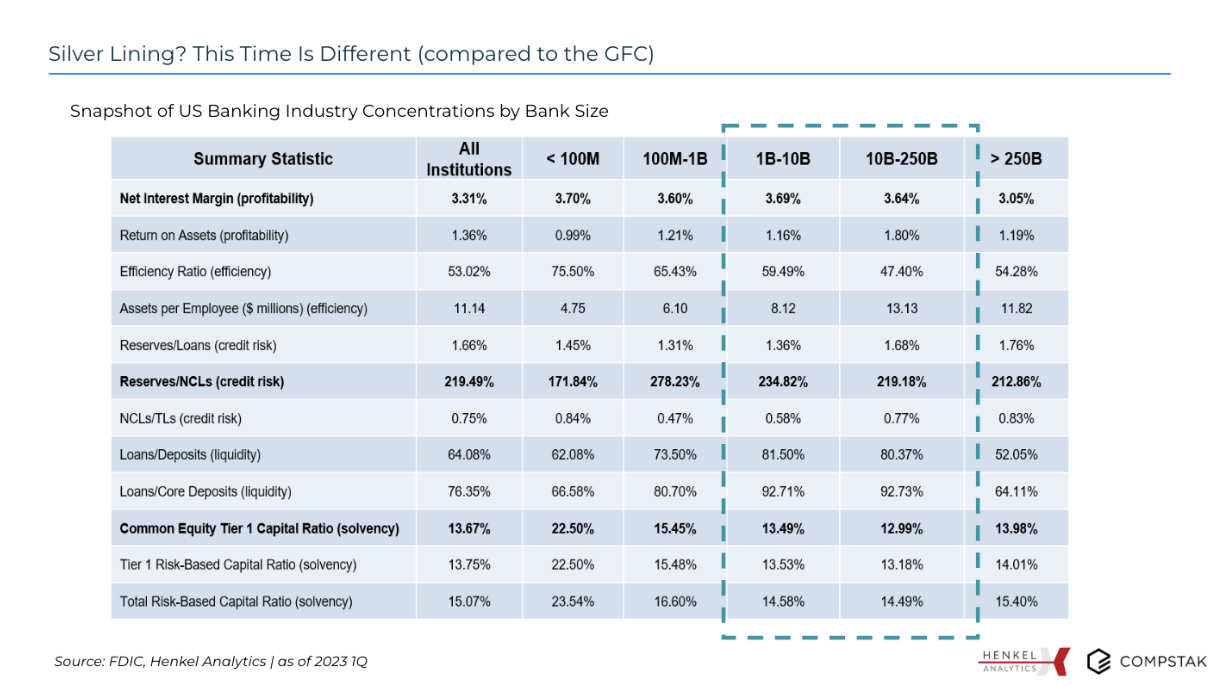
Is the regional banking situation contained or will it get worse?
There is cautious optimism that the worst is over as far as news of complete bank failures. In contrast to the previous recession, banks are better capitalized and regulated, which should help them better weather the current economic turbulence. Regional/community banks with assets in the range of $1 billion to $250 billion in assets are also setting aside higher levels of reserves relative to their loans than they ever have in the past, according to Henkel Analytics. With these actions, banks are being more proactive in preparing for negative outcomes from bad loans.
And in another positive sign, more than two-thirds of banks reported tightening of standards for CRE loan applicants, according to the most recent results from the Federal Reserve’s Senior Loan Officer Opinion Survey on Bank Lending Practices. Moreover, tightening standards have been rising since the beginning of 2022.
On the other hand, high levels of maturing CRE debt do pose a continued threat to lenders, especially community and regional banks. Today’s maturing loans likely originated in a much lower interest rate environment than they are encountering today at maturity. This creates elevated default risk especially as borrowers are also dealing with negative pressure on net operating income (NOI) from rising vacancy, operating costs and flattening or declining effective rents at the same time as debt service costs are rising. This is of particular concern to the office market where borrowers are increasingly seeking extensions.
Where is regional bank lending in CRE most highly concentrated and what is the state of CRE in industrial or office in those markets?
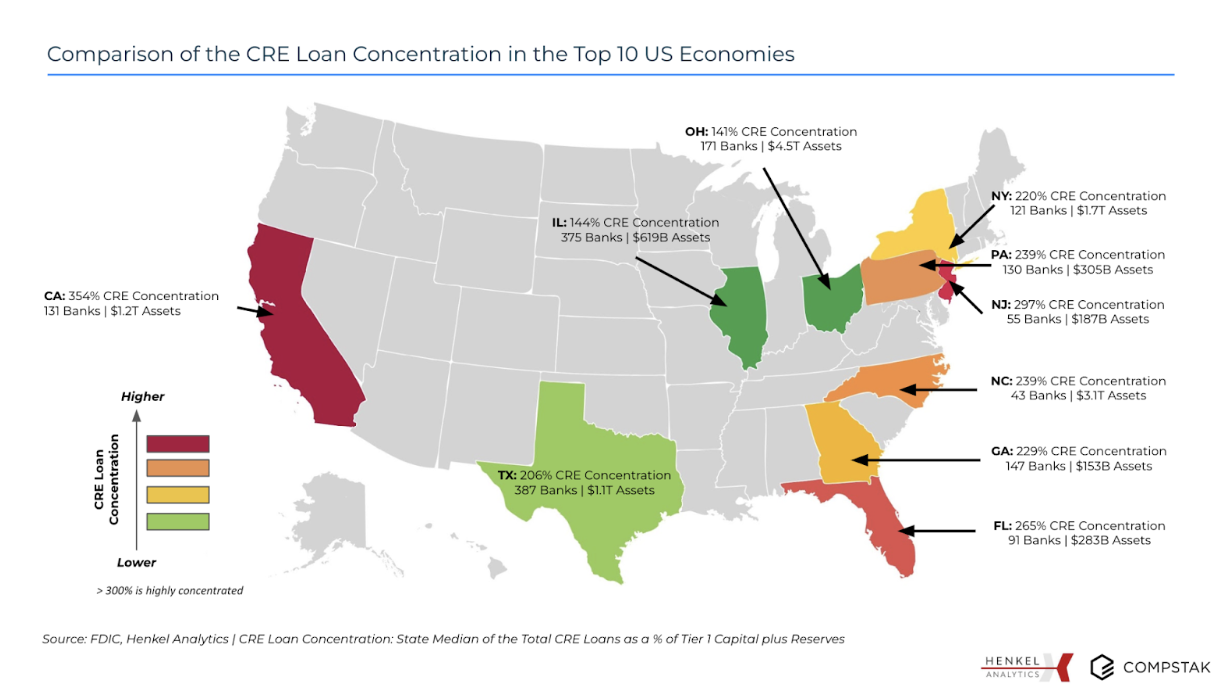
Of the top 10 U.S. economies by state GDP, the median CRE loan concentration (median ratio of commercial real estate loans outstanding divided by banks’ tier 1 capital plus reserves) is highest in California with 354% ratio, while Ohio and Illinois rank the lowest, with 144% and 141% ratios, respectively. Markets like New York fall in the middle with a median CRE loan concentration of 220% for the state. Banks and markets with higher CRE loan concentrations are much more highly exposed to CRE and are expected to be more conservative in future lending and selective with originating new loans.
Within these markets, CompStak evaluated leasing trends including rental rates and concessions for the following major industrial and office markets as a snapshot of where more or less risk may exist for regional and community bank CRE loans. These markets and sectors include:
- Office – CA – Bay Area, Los Angeles, and San Francisco, NY-New York City, and TX- Houston and Dallas
- Industrial – CA- Los Angeles-OC-Inland Empire, TX-Dallas-Fort Worth and Houston, FL- Miami-Fort Lauderdale, and NJ-North and Central
Office Sector Snapshot
The office sector remains the most beleaguered sector as occupancy rates have largely stagnated and major leases, even those signed on for short term extensions during the pandemic, are now expiring. In a more recent hit to the sector, the technology industry, once a bright spot in office absorption preceding and during the early parts of the pandemic, is pulling back on new office demand and rightsizing. CompStak evaluated the effective and concession trends in several of the major office markets in these states with moderate to high median CRE loan concentrations: Texas, California and New York and uncovered the following findings:
- Effective rents are down from 2019 levels in San Francisco, the Bay Area, New York City, and Los Angeles. San Francisco’s average effective rent has fallen over much of the last three years, while Manhattan’s has increased slightly from Q3 2021. Markets like the Bay Area and Dallas-Fort Worth have recovered above 2019 levels in recent quarters with the exception of Q1 in the Bay Area. Leasing in new construction or trophy in the Uptown Turtle Creek and Preston Center submarkets in Dallas has resulted in a jump in Dallas rents in recent quarters.
- Concessions, especially for Class A space, continue to be on the rise, and tenants are inking deals with increasing shares of their lease terms as rent-free periods. Manhattan’s average free rent ratio of term increased 390 basis points from 2019 to 9.6% of term, while San Francisco and Bay Area South also saw a considerable jump to 5.8% and 6.0% of lease term, in San Francisco and Bay Area, respectively.
- Within Class A buildings, tenant demand for high quality buildouts has coincided with ballooning construction costs which have only recently begun to stabilize. In Dallas, for example, the average tenant improvement allowance is up more than 20% since the end of 2019 and in Manhattan they are up more than 22%.
- Finally, any recovery in effective rents has been strongly driven by leasing activity in top-tier product especially new construction (buildings constructed within ten years of lease execution) and renovated buildings. Meanwhile, effective rents for deals closing in B/C buildings built before 2000 and not recently renovated still have effective rents below 2019 levels. New construction effective rents have increased significantly the past two years across these markets and are now up 14.3% from 2019 or more than 40% from 2018.
Industrial Sector Snapshot
The industrial sector is expected to remain relatively stable even if economic woes accelerate. While industrial’s voracious appetite for space has slowed slightly, consumer demand is still holding despite stubborn inflation and increased churn in the labor market. Still, the annual double-digit rent growth experienced in many markets may be slowing and return to more sustainable levels of growth. CompStak evaluated the rental rate trends in several of the major industrial markets in these states with moderate to high median CRE loan concentrations: Texas, California, Florida and New Jersey and uncovered the following findings:
- The demand for large industrial spaces boomed during the pandemic leading to a rise in transaction size from the beginning of 2021. As a result, average starting rents for transactions over 50,000 square feet rose faster than those for spaces below that threshold. In 4Q 2019, the average starting rent for transactions below 50,000 square feet was 49% higher but by 4Q 2022 this had compressed to a 20% premium across the LA-Inland Empire, Houston, Dallas-Fort Worth, NJ- North and Central, and Miami-Ft. Lauderdale markets. In California’s Inland Empire specifically, spaces above 50,000 square feet are still trading at a higher starting rent per square foot than those below that threshold over the last year.
- Since 3Q 2022, year over year rent growth has been falling faster for renewals and extensions in four of these five major markets as compared to year over year rent growth for new deals/expansions with the exception of the nation’s outperforming LA-Inland Empire market. For example, in NJ- North and Central market, year over year starting rent growth for renewing/extending tenants fell 12.7 percentage points from last quarter as compared to a 4.6 percentage point decline over the same period for new transactions. This could be an early indicator that industrial users are regaining some negotiating power as space demand wanes slightly amid concerns about the economy.
- Lastly, CompStak’s data on annual industrial lease escalations which rose largely in concert with inflation since Q2 2021 are now stabilizing in recent quarters’ data. In Miami-Fort Lauderdale’s industrial market, the average annual lease escalation increased 3.09% in Q1 2020 to above 3.8% in 2023.
What is the outlook going forward?
As discussed in the webinar, many expect that alternative lenders may increase their volume and exposure to CRE as banks pull back. Other sources of capital like credit funds, are anticipated to expand their lending presence further. In addition, all eyes will be on loan maturities especially in the office sector, and the volume of extensions and workouts as relative to to defaults. Finally, the health of CRE loans and regional banks may largely hinge on how the economy performs over the rest of 2023. The regional banking tumult coupled with May’s stronger than expected jobs report leaves the Federal Reserve with a challenging decision to make next week—will they take a pause or enact the 11th rate hike of this tightening cycle?
Want to learn more about the regional banking crisis? Try CompStak!
Related Posts
CompStat: DFW Office Momentum, Cold Storage Supply, Grocery Anchored Retail


